Accelerate your research

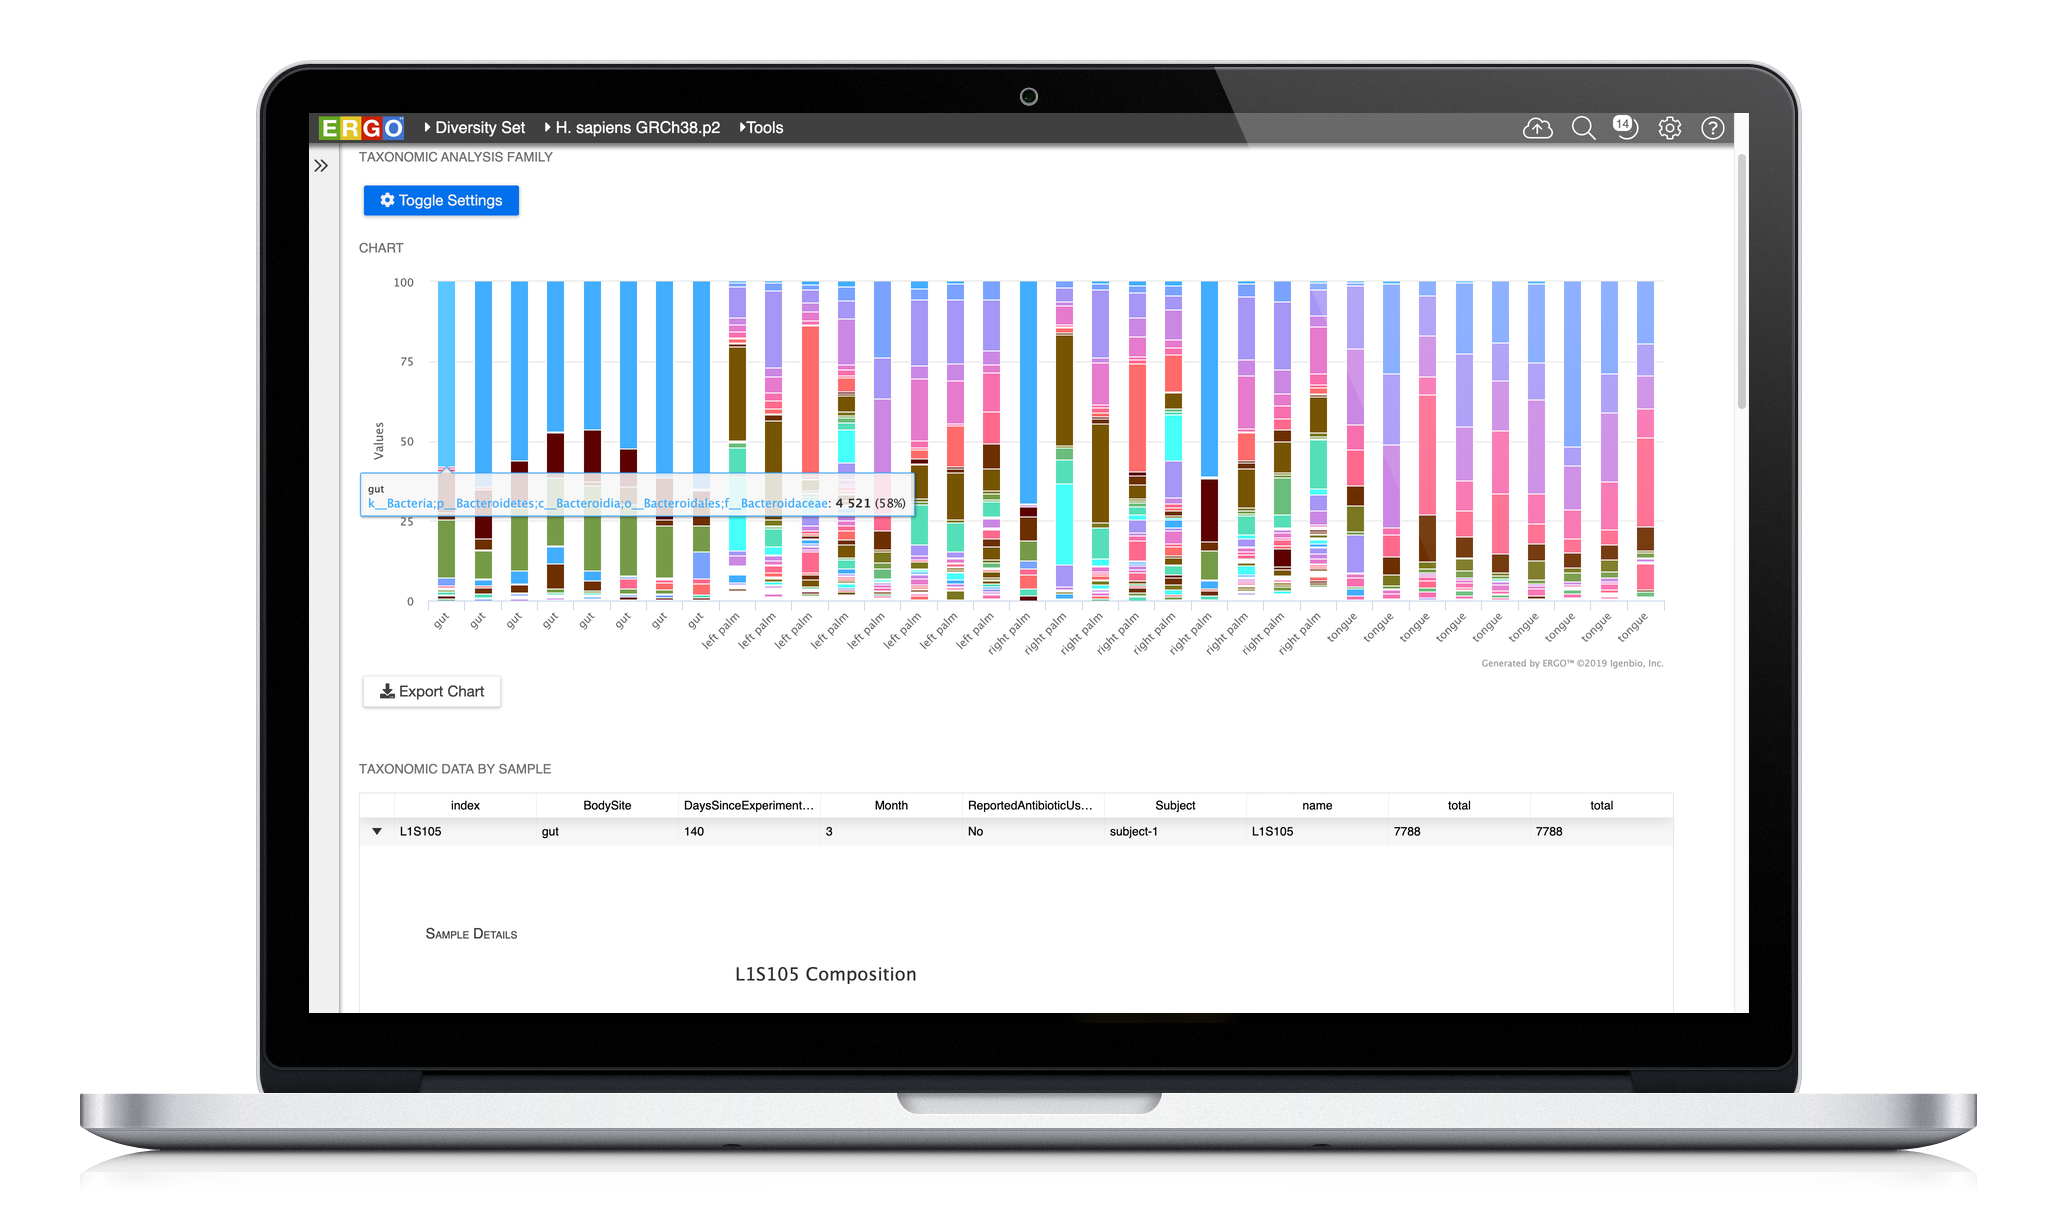
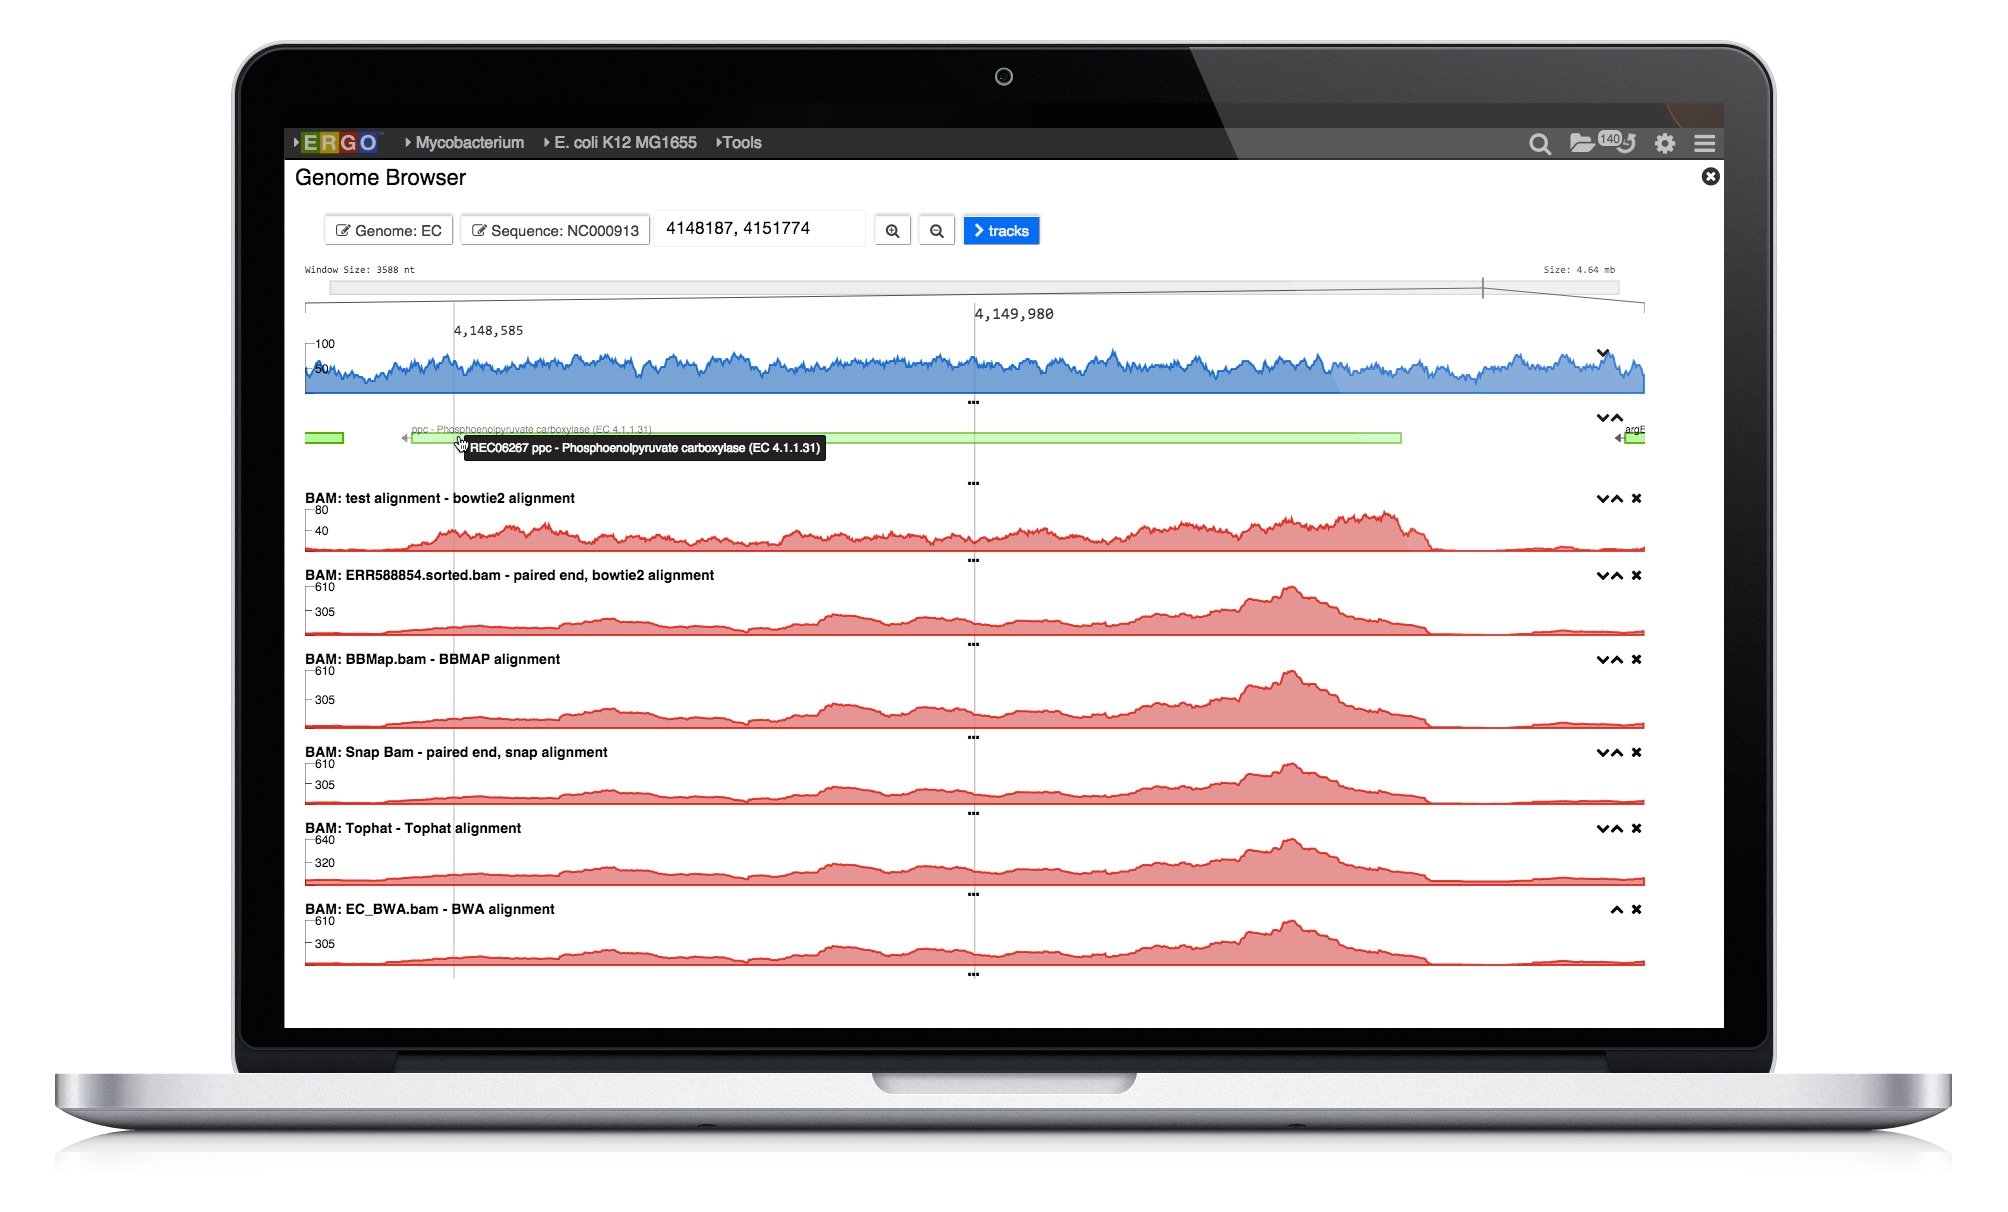
ERGO 2.0 provides a systems biology informatics toolkit centered on comparative genomics to capture, query, and visualize sequenced genomes. Using Igenbio's proprietary algorithms, and the most comprehensive genomic database integrated with the largest collection of microbial metabolic and non-metabolic pathways, ERGO™ assigns functions to genes, integrates genes into pathways, and identifies previously unknown or mischaracterized genes, cryptic pathways, and gene products.

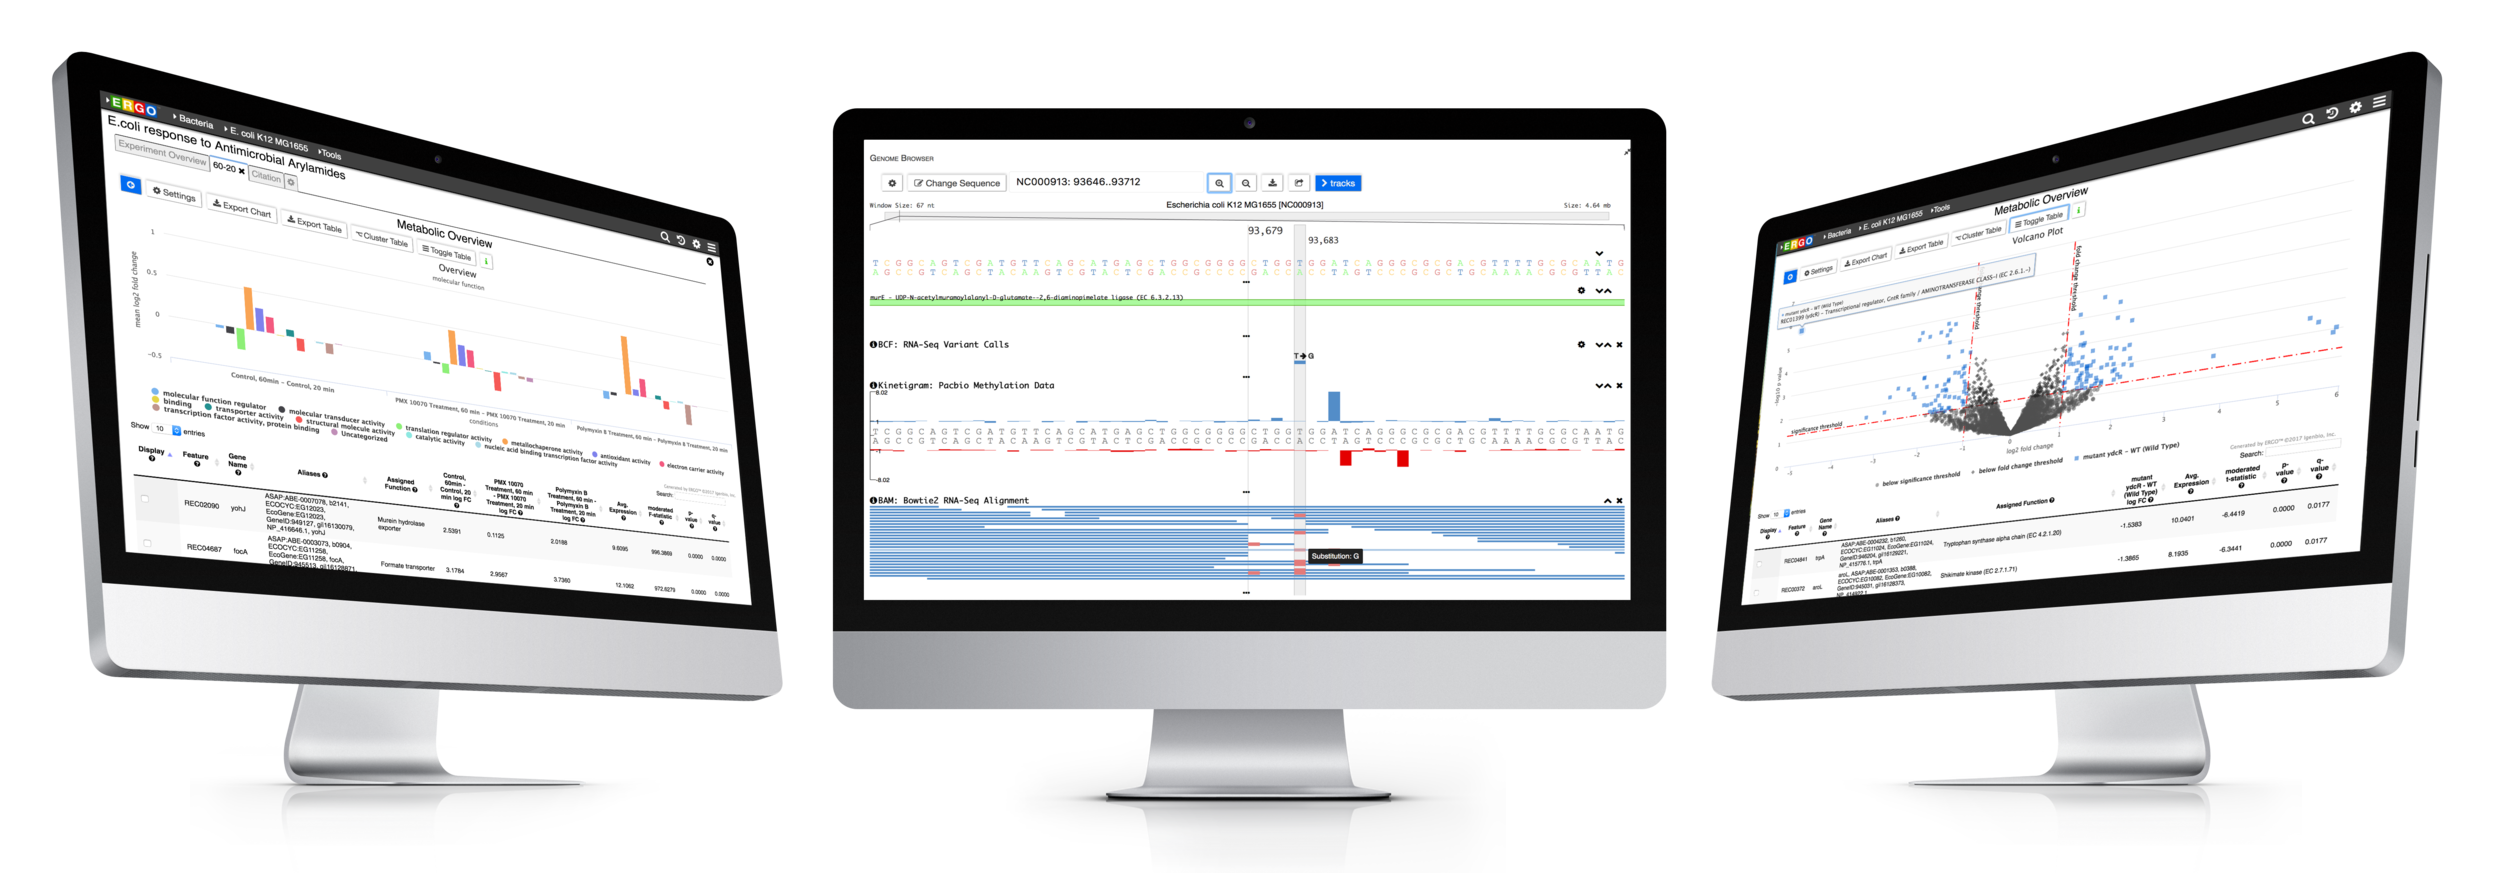
ERGO 2.0’s hand-curated content combined with cutting edge genomics and bioinformatics tools help scientists in the biotechnology, agriculture, and pharmaceutical industries understand and design the underlying biology leading to new products faster.
ERGO Features
Easily analyze your metagenome projects using ERGO by dragging and dropping your BIOM file into ERGO. Compute the Principal Coordinates Analysis (PCoA), Richness Estimates, and Taxonomic Bar Charts at a click of a button. In addition, ERGO computes Analysis of Similarities (ANOSIM) to test the significance of group differences.
Simple, Fast, and Secure sequence analysis.
ERGO Workflows could not be easier - simply drag and drop your sequence files into ERGO and start your analyzing. There is no simpler way to perform RNA-Seq and Variant analysis.
Learn more about how ERGO Workflows can power your research needs.
ERGO is the premier annotation platform, providing scientists and researchers with deep insight into their strains. Using a combination of proprietary algorithms, sequence similarity, gene context clustering, regulatory and expression data ERGO can deduce the core functionality of prokaryotic and eukaryotic genomes.
Visualize genomes by functional systems or subsystems and understand the distribution of metabolic and non-metabolic pathways. Powerful visualizations facilitate not only genome sequence comparison but also metabolic comparison for greater understanding of genome plasticity, gene displacement and orthologous displacements.
Integrate your expression data with ERGO to Identify differentially expressed genes from RNA-Seq, cDNA, EST, Microarray, and other expression studies. ERGO automatically performs statistical analysis presenting the differentially expressed genes in their metabolic context. Visualize your expression data on KEGG pathway maps. No knowledge of statistical techniques or tools are necessary.
Learn more about RNA-Seq and Expression Analytics in ERGO 2.0
Explore the variation between your strains. ERGO identifies and annotates Single Nucleotide Polymorphisms (SNPs), Insertions, and Deletions (InDels). Quickly discover ablated transcripts, frameshifts, start/stop codon loss, and more.
Read more about Variant detection, annotation, and analysis in ERGO.
ERGO 2.0 deduces the core metabolic functionality of a whole organism from genome sequence data. This enables scientists to accelerate their research for strain improvement, optimization, and product development.
ERGO 2.0 tools enable scientists to explore strain differences. Utilizing our publication proven Genome Align tool scientists are able to visually explore differences. Comparative protein clustering tools enhance identification of common and unique clusters or ORFs, highlighting features that could be used in generating primers for expression studies containing groups of organisms.
Multiple Sequence Alignment
Pairwise Sequence alignment
Creating and viewing taxonomic trees
Genome Alignment
Automated and Manual Genome Annotation
ERGO Database of 3000+ annotated genomes
KEGG Pathway Database
MetaCyc, EcoCyc, and BioCyc databases.
Gene Ontology
RefSeq
Swissprot
Uniprot
Access ERGO through our secure cloud from anywhere in the world. Your data is encrypted at all times; at rest and in transit. Private cloud and secure internal network installations are also available. Contact us for details.
ERGO's incredible proprietary database and toolset is now available via a REST API. Easily integrate ERGO with your existing tools and infrastructure.
Easily import and export standard genomics formats such as:
Genome Feature Format (GFF V2/V3)
FASTA
GenBank
CSV/Text
Variant Files (VCF/BCF)
and others
Proven scientific results with ERGO.
ERGO has been cited hundreds of times from researchers all over the world.
ERGO is used by scientists worldwide.
“We have found the ERGO discovery system to be exceptionally useful tool for our metabolic engineering projects and expect that it will assist us in developing new production strains for higher and more cost effective production of biological compounds.”
“We are delighted to be working with Integrated Genomics ... The ERGO™ platform will enable us to further understand and exploit our thermophilic strains to their fullest potential to deliver the next generation of green biofuels.”
“The ERGO™ platform gives us a valuable and comprehensive resource for our genomics studies and provides a powerful data-mining environment for our scientists”
“As DANONE is working on probiotics products, ERGO is a great database to help us to find probiotic functions in our strains.”
We’ve added to ERGO’s rich suite of tools and workflows for 16S amplicon sequencing studies to include functional metagenome prediction utilizing Picrust2.
Do the differences you see on the ordination plot represent a significant difference? This is one of the key questions researchers ask themselves. One way to determine significance is permutational multivariate analysis of variance (PERMANOVA), a statistical test commonly used in ecology settings [1]. ERGO uses the 'adonis' function in the R package vegan which provides functions for the analysis of ecology [2].
Non-metric dimensional scaling attempts to closely represent pairwise dissimilarity between samples. It is a robust unconstrained ordination method that uses rank orders commonly used in ecology studies. Unlike many other ordination techniques NMDS iterates to find a solution that fits with an optimal stress value to the number of chosen dimensions. ERGO gives you a simple interface to choose the number of attempts, dimensions, along with an option to specify a previous best stress.
Data mining and visualization just got easier in ERGO’s newest microbiome analysis update.
We’ve added to ERGO’s rich visualizations with a new plot type: the violin plot. A violin plot is a way to visualize an underlying distribution of values (in our case, log fold change). Similar in utility to a box plot, a violin plot has a few advantages. Instead of just representing the median, quartiles, minimum and maximum, a violin plot uses a kernel density estimation algorithm to visualize the distribution of underlying points.
ERGO’s [Overbeek et. all 2003] rich suite of tools and workflows to examine amplicon and metagenome sequencing now includes Linear Discriminate Analysis using LEfSe [Segata et. al 2010]. In ERGO, LEfSe (Linear discriminate analysis Effect Size) enables researchers to discover biomarkers that most likely explain the differences between selected experimental groups.
Flyers and Info Sheets

Includes KEGGTM pathway/genome databases under license from Pathway Solutions, Inc.