
Igenbio's publication-proven genome annotation platform ERGO delivers outstanding results.
High quality functional annotations must be the heart of any major genomics project. Our methods have been featured in dozens of peer-reviewed publications and are depended upon by institutions worldwide.
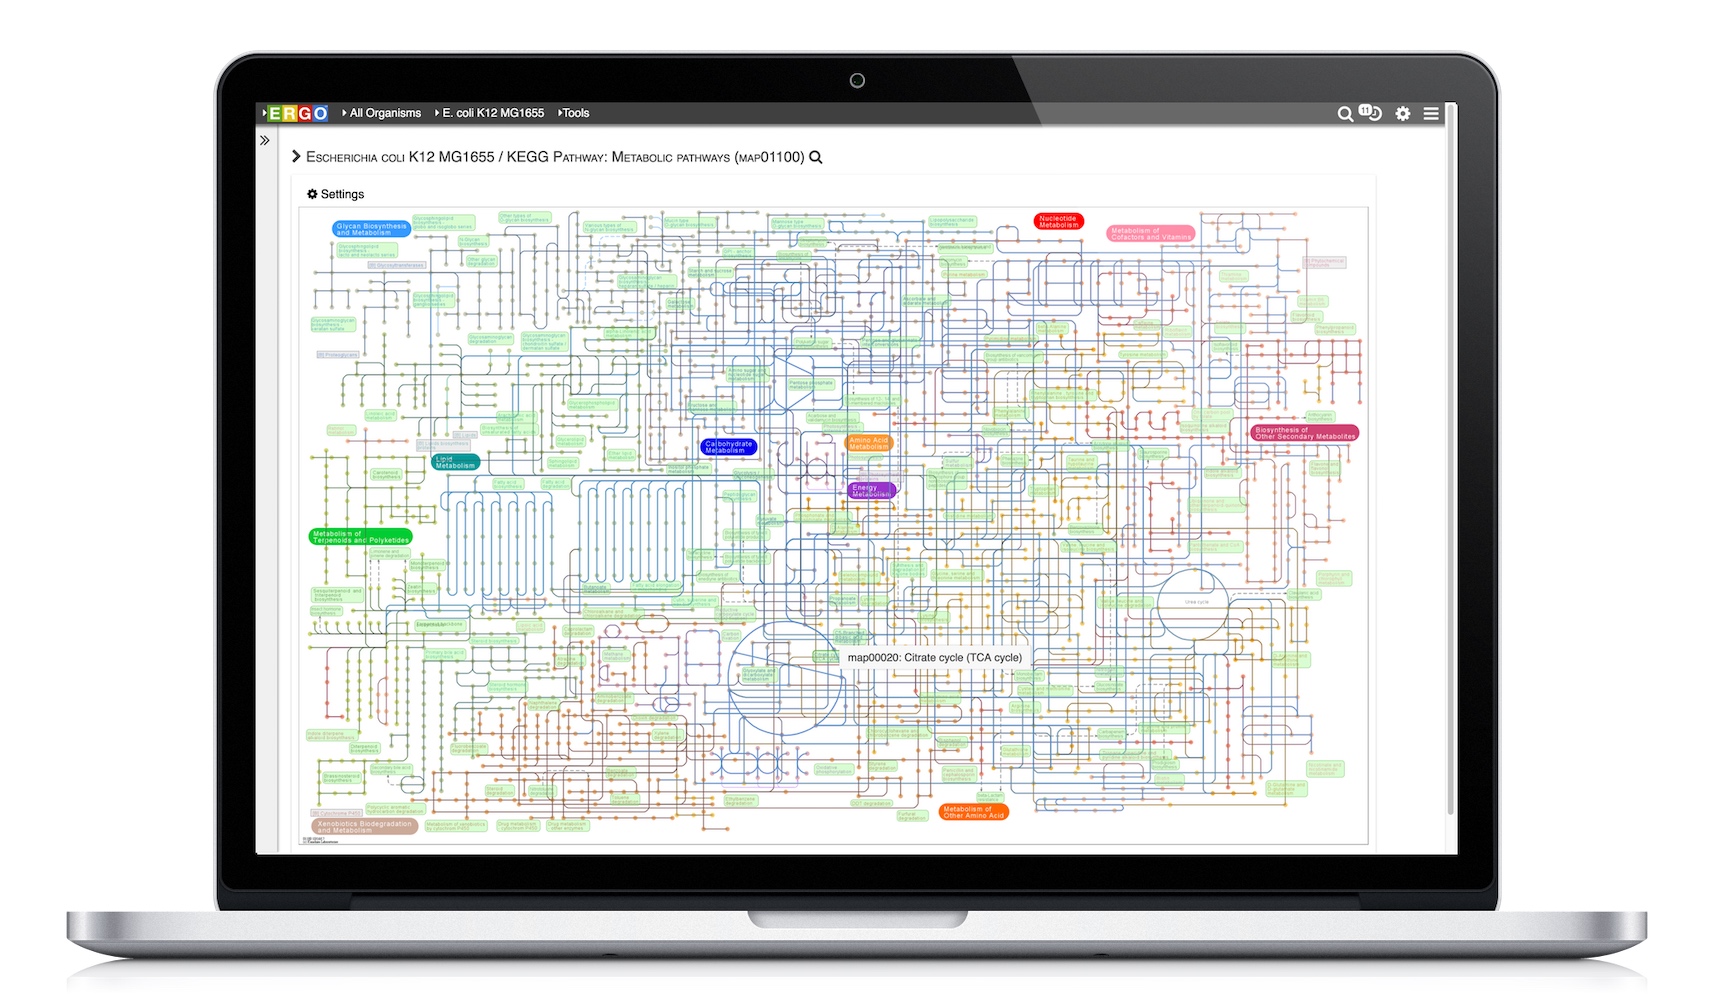
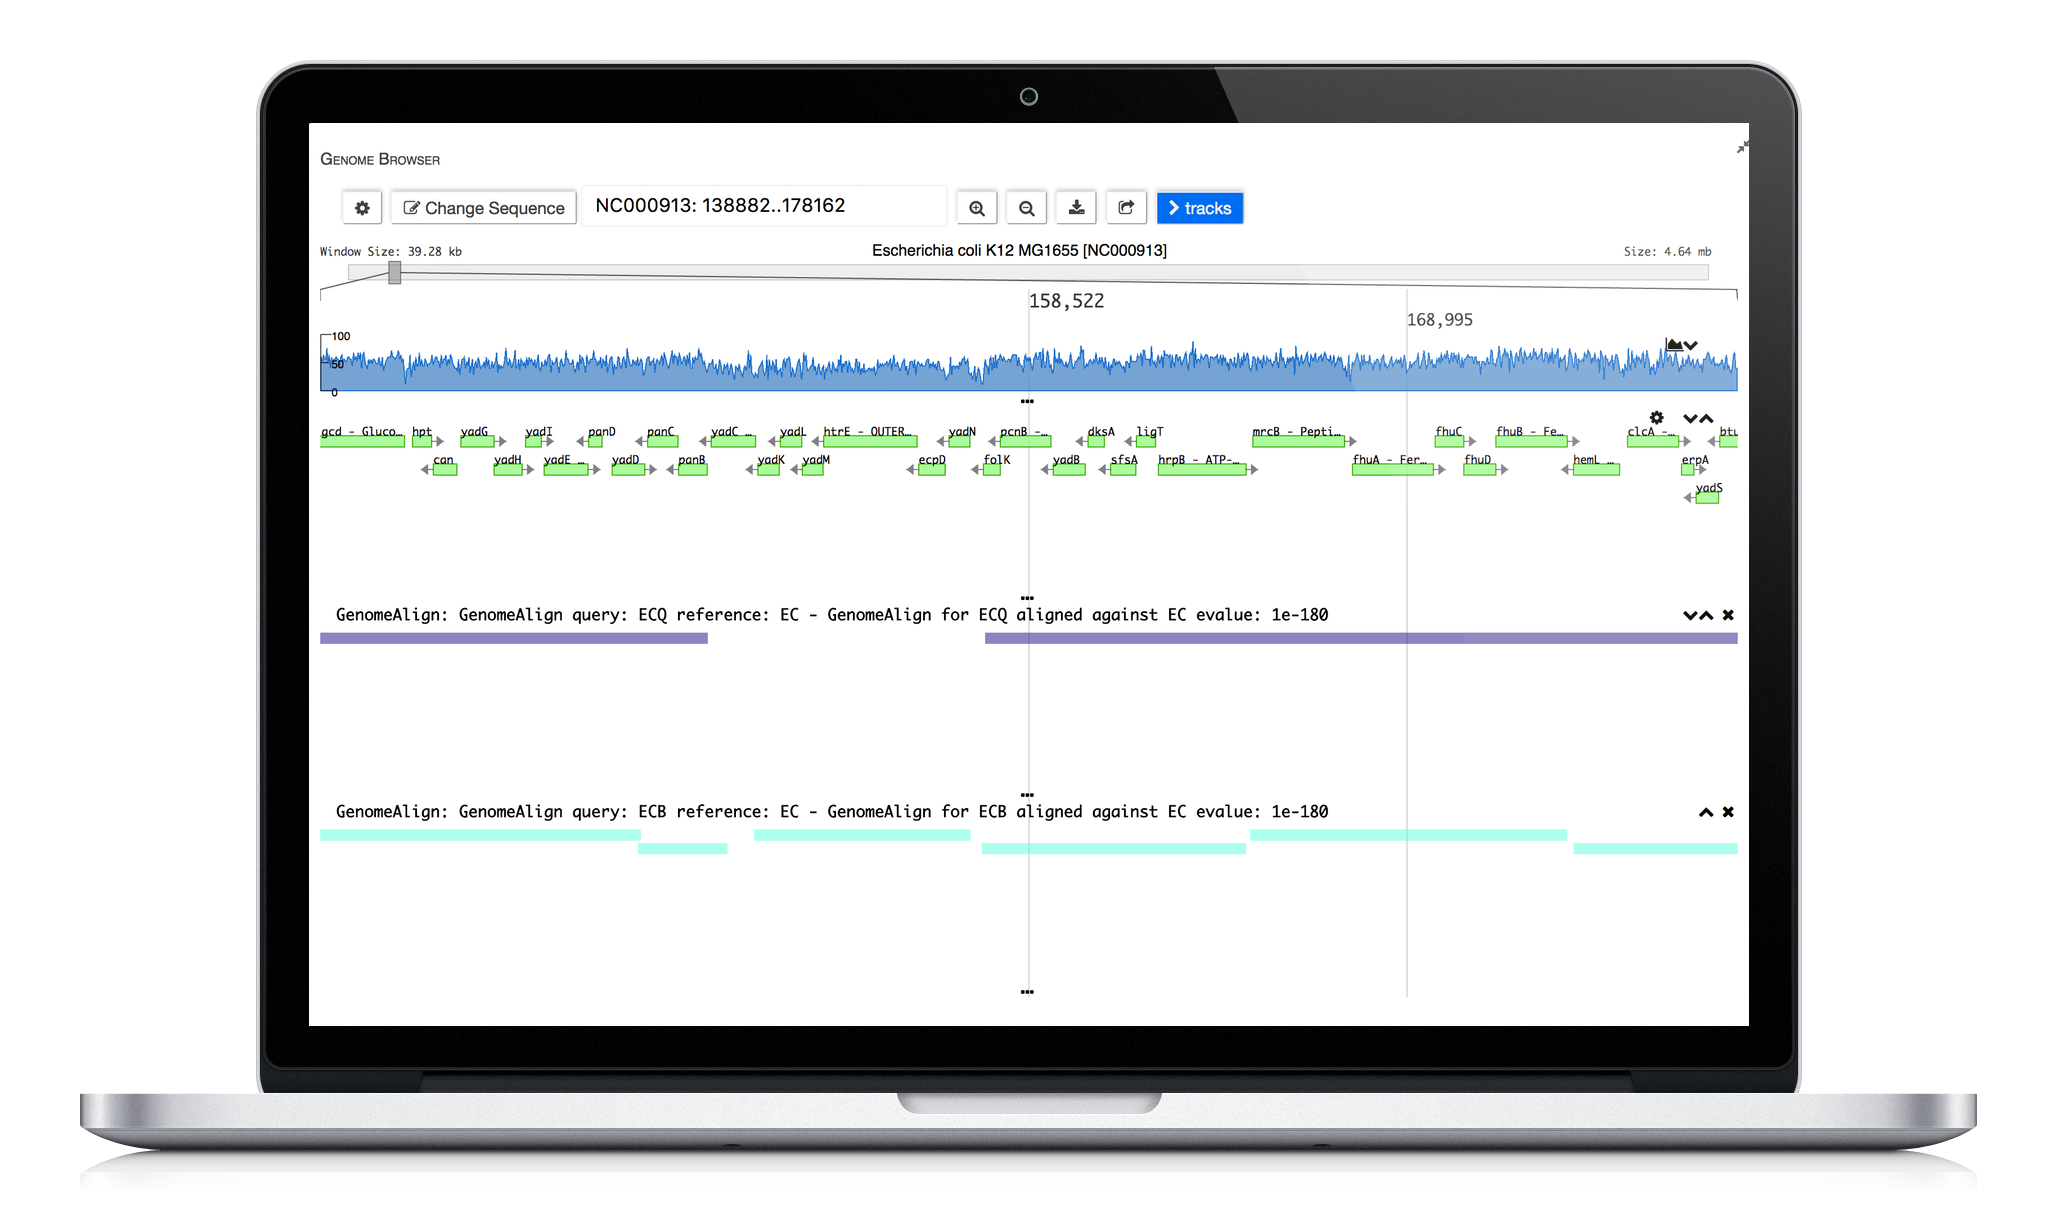
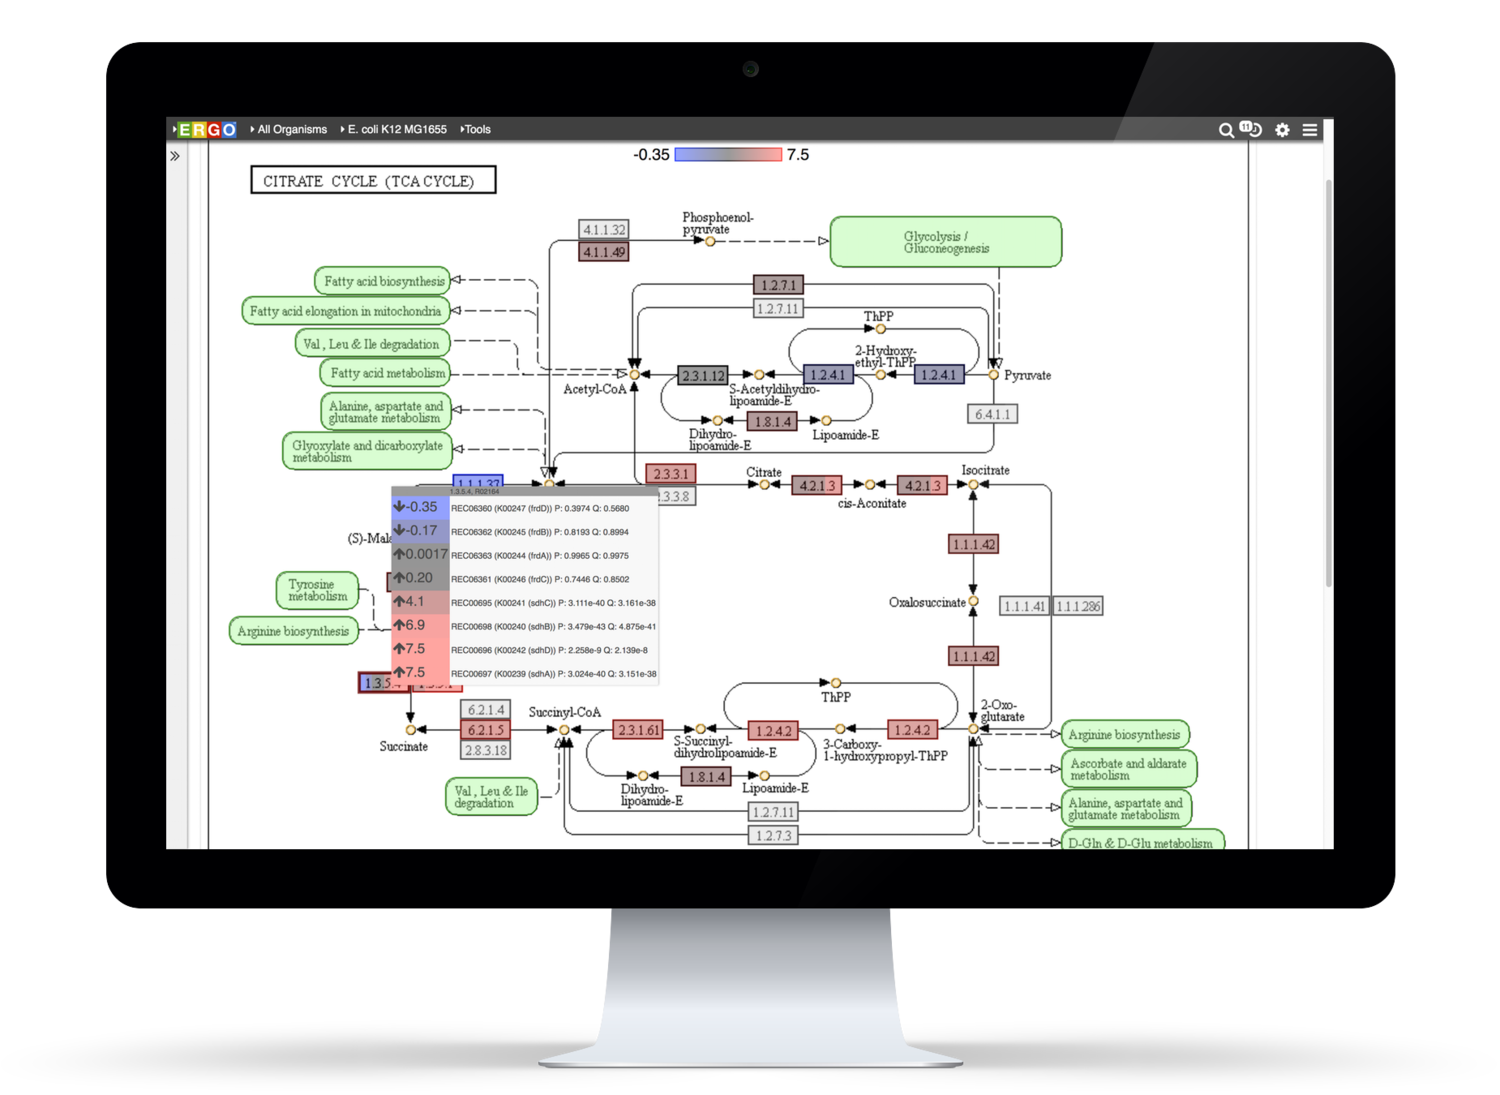
The basis of our annotation pipeline starts with combining high quality next generation sequencing (NGS) data and state of the art genome assembly to produce large, high quality contigs and scaffolds. ERGO identifies more genes more accurately because it doesn't rely on sequence similarity alone - the entire genome structure is considered. In addition to using state of the art algorithms, our expert scientists manually curate genome annotations. All of this is done with one goal - the highest quality functional annotation and metabolic reconstruction.
Our annotation platform will help you reach your research and industrial goals faster.
Learn More about ERGO 2.0
Easily analyze your metagenome projects using ERGO by dragging and dropping your BIOM file into ERGO. Compute the Principal Coordinates Analysis (PCoA), Richness Estimates, and Taxonomic Bar Charts at a click of a button. In addition, ERGO computes Analysis of Similarities (ANOSIM) to test the significance of group differences.
Simple, Fast, and Secure sequence analysis.
ERGO Workflows could not be easier - simply drag and drop your sequence files into ERGO and start your analyzing. There is no simpler way to perform RNA-Seq and Variant analysis.
Learn more about how ERGO Workflows can power your research needs.
ERGO is the premier annotation platform, providing scientists and researchers with deep insight into their strains. Using a combination of proprietary algorithms, sequence similarity, gene context clustering, regulatory and expression data ERGO can deduce the core functionality of prokaryotic and eukaryotic genomes.
Visualize genomes by functional systems or subsystems and understand the distribution of metabolic and non-metabolic pathways. Powerful visualizations facilitate not only genome sequence comparison but also metabolic comparison for greater understanding of genome plasticity, gene displacement and orthologous displacements.
Integrate your expression data with ERGO to Identify differentially expressed genes from RNA-Seq, cDNA, EST, Microarray, and other expression studies. ERGO automatically performs statistical analysis presenting the differentially expressed genes in their metabolic context. Visualize your expression data on KEGG pathway maps. No knowledge of statistical techniques or tools are necessary.
Learn more about RNA-Seq and Expression Analytics in ERGO 2.0
Explore the variation between your strains. ERGO identifies and annotates Single Nucleotide Polymorphisms (SNPs), Insertions, and Deletions (InDels). Quickly discover ablated transcripts, frameshifts, start/stop codon loss, and more.
Read more about Variant detection, annotation, and analysis in ERGO.
ERGO 2.0 deduces the core metabolic functionality of a whole organism from genome sequence data. This enables scientists to accelerate their research for strain improvement, optimization, and product development.
ERGO 2.0 tools enable scientists to explore strain differences. Utilizing our publication proven Genome Align tool scientists are able to visually explore differences. Comparative protein clustering tools enhance identification of common and unique clusters or ORFs, highlighting features that could be used in generating primers for expression studies containing groups of organisms.
Multiple Sequence Alignment
Pairwise Sequence alignment
Creating and viewing taxonomic trees
Genome Alignment
Automated and Manual Genome Annotation
ERGO Database of 3000+ annotated genomes
KEGG Pathway Database
MetaCyc, EcoCyc, and BioCyc databases.
Gene Ontology
RefSeq
Swissprot
Uniprot